This is the first in our series on common Power BI mistakes.
You can find the other articles here
Let’s start at the very beginning of everyone’s Power BI adventure…
The first thing 99% of people do with Power BI is connect it to some data. And many will connect it to a single, sprawling data table — known as the one big table (OBT) approach.
When you’re itching to start building a snazzy dashboard, it can be tempting to just import ‘all of the data’ by hooking up to any old database for that table or grabbing the many tabs of the spreadsheets from your accounts department’s notorious ‘Cave of Wonders’. And that’s largely because it’s so easy to bring in data to Power BI without stopping to consider which data is necessary or the impact of storing it.
Therein lies the problem. OBT data models lead to the storage of large amounts of redundant data, with every column further torpedoing the chance that your model will be optimally structured to maximise the internal workings of Power BI’s storage engine.
This can negatively affect Power BI reporting in several ways, including slowing down performance, taking up unnecessary storage space, and creating a less user-friendly experience. Additionally, you’ll find that as your reporting requirements grow, an OBT data model creates extra headaches due to its innate lack of scalability and flexibility.
So, unless you’re building a quick, I-need-it-yesterday, one-off report or a proof of concept, OBTs do not provide a good basis for reporting.
Let’s dive into exploring a better approach and defining some key terms.
What is a data model?
A data model is a conceptual representation of data structures within a system, showing how different elements are organised and how they interrelate. It serves as a blueprint for how data is stored, accessed, and managed. In most databases, the goal of a data model is to efficiently capture and store transactional data. However, in Power BI, there’s a focus on optimising data for analysis and visualisation.
Why is data modelling important in Power BI?
A well-designed Power BI model helps answer key organisational questions through data analysis, while also being optimised for:
- Efficient query performance, to quickly populate visuals with relevant data
- Compact size, to minimise maintenance costs
- Minimal complexity for end users
The structure of the model will be driven by your organisation’s specific analysis requirements.
Read more
A better approach: Star schema data models
So, what should you do instead of using an OBT?
The best practice answer is to create a star schema data model. This works particularly well for performing analysis in Power BI.
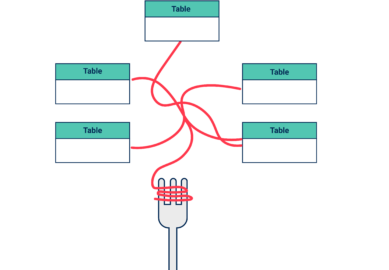
In a star schema model (so called because of the way they look), data is organised into a series of tables. These models contain one or more central tables (facts) surrounded by several related tables (dimension tables).
Compared to the OBT approach, star schemas enable you to work more efficiently and cost-effectively by:
- Improving query performance
- Reducing data storage size
- Reducing complexity for end users.
Let’s unpack some key terms, what’s involved, and the advantages of this approach.
What are facts and fact tables?
Facts are quantitative data such as sales amounts or quantities. Facts are also described as events or occurrences. A fact table forms the centre of a star schema model. Each row in a fact table contains dimension keys (also known as codes) which link it to the descriptive data stored in various related dimension tables.
Fact tables enable data summarisation, as they can be aggregated up to the most appropriate level to suit reporting. For example, rolling up order data to a monthly rather than weekly or daily level. This can vastly reduce the number of rows needed to store data.
What are dimensions and dimension tables?
Dimensions are descriptive data about facts, such as product, customer, and location. A star schema model contains multiple dimension tables which each link to the central fact table(s).
Each row in a dimension table is placed against an (ideally) unique identifier which links it to the fact. The most common type of dimension is a Calendar or Date table. Dimension tables enable filtering and grouping of data.
What is a relationship?
Relationships connect dimensions and fact tables, normally via a key or a date (sometimes represented by integers). Each row in a dimension table has a unique key or code which corresponds to one or more rows in the fact table, indicating the context of the facts.
In a star schema model, there is only one direct relationship between a fact table and each dimension. There are no indirect relationships.
Read more
Transforming your OBT data for a star schema model
To create a star schema data model from your OBT, you need to reorganise and streamline your existing data. In particular, you need to normalise your denormalised data. You can use Power Query to help with this.
Denormalised data
Denormalised data is characterised by lots of redundant or repeated data inside a single table. The placement of all data in one place is often done to avoid costly joins within a database, but it’s not ideal for building reporting models.
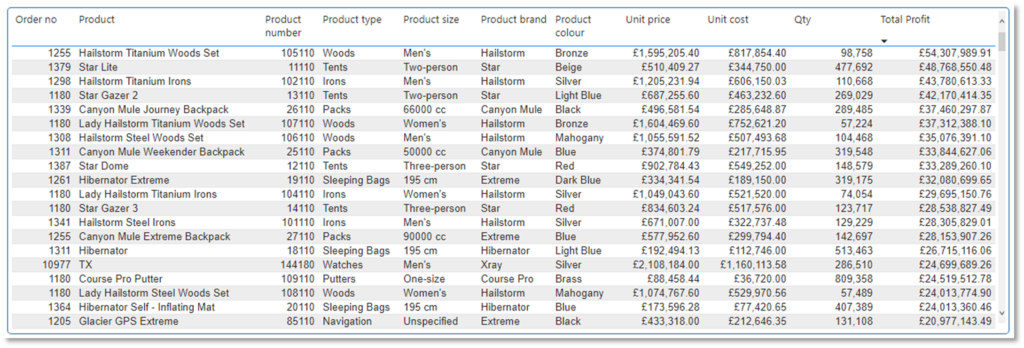
Figure 1 shows a sample of denormalised data, with order and product data placed in the same table. Storing all of this data in one table means the high-cardinality values of product, product type, product brand, and product colour are repeated many times — consuming a relatively large volume of storage. Now imagine if this table had 250 million rows, and also contained columns for sale location, retail operative, and customer name. I’m having kittens just thinking about how much more repeated data this would add into the model, taking up even more storage space.
Normalised data
Normalised data is organised into separate tables (dimension and fact tables). Each table contains data about one theme or one entity only, eliminating unnecessary data repetition.
For example, a Product table for all data that describes the product. And a separate Customer table for all data that describes the buyer — but, crucially, does not contain any information about products they have bought.
Normalising data ensures descriptive data only resides in one place, greatly reducing the amount of storage required.
A star schema example
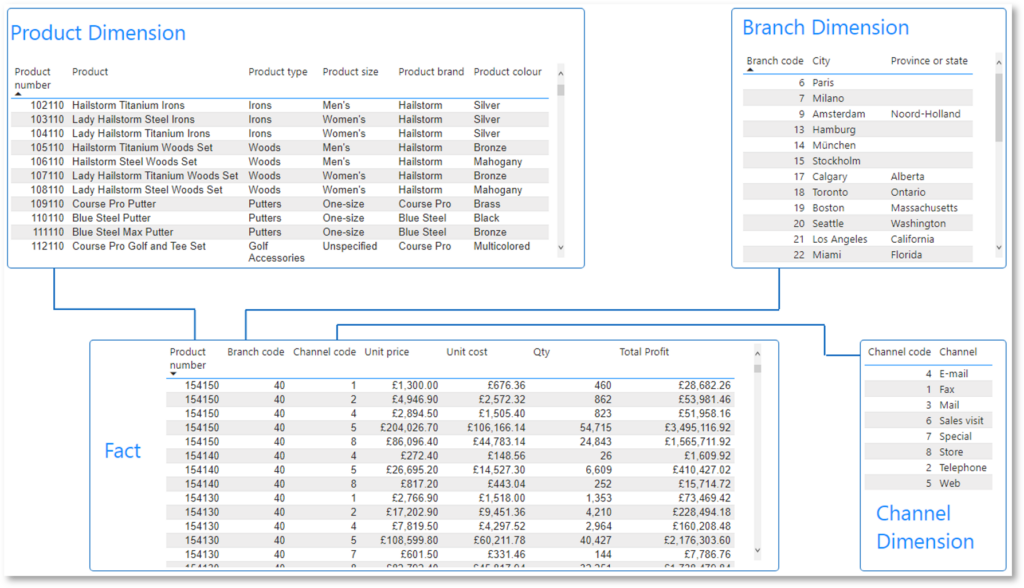
Drawing on the same example data as Figure 1, Figure 2 shows a simple star schema using normalised data. Product data has been separated so that each product is unique.
While there is still repetition of product types, sizes, brands, and colours, this data is now only repeated by the number of products, rather than the number of orders. As a result, this high-cardinality data can be stored in a table with only around 1,000 rows, rather than 250 million rows.
While the exact numbers will depend on each model’s specifics, a star schema using normalised data will always mean far fewer rows, requiring less storage space.
In Figure 2, the fact table and product dimension table are joined via the product number relationship, which allows the dimension to summarise the fact. Similarly, the branch and channel dimensions are linked to the fact table via branch codes and channel codes (keys) respectively.
The benefits of a star schema model for Power BI
Having established what you should do, it’s now time for us to dig into why a star schema data model functions much more effectively than an OBT for Power BI.
Improved query performance
Improved query performance
Power BI’s query engine only reads the columns needed to return the right information for the desired visual. Ensuring the engine has fewer rows to read within these columns will speed up this process.
You can achieve this by:
- Separating descriptive data into dimensions, which decreases the rows in filtering tables.
- Aggregating event data in a fact table. This condenses the data, e.g. representing a whole year in a single row instead of 365 separate rows for each day of the year.
Swifter queries don’t only generate faster-loading visuals and happier end users, but also reduce your time spent diagnosing and fixing issues relating to slow calculations.
Reduced size
Reduced size
Compressing your data leads to a smaller data model, saving on storage needs.
When ingesting data, Power BI uses a box of tricks called the VertiPaq engine, which is responsible for compression and oh-so-much more. VertiPaq is explained expertly in this and this article, so I won’t repeat their information here. Instead, I’ll focus on what moving away from an OBT does to improve compression:
- Reduces the row count in tables.
- Decreases the number of unique values in columns. E.g. by aggregating a fact table to the month level, a date column will store just one value for a month (either month start or end), instead of multiple daily values.
- Minimises column repetition to reduce the distribution of columns.
Greater data compression increases both operational efficiency and cost savings. It cuts down the maintenance expenses of a model by lightening the load on your Power BI Premium Capacity (if you use one) during both data refreshes and report access.
If you’re not using a Premium Capacity, enhanced compression means you can potentially delay purchasing one. And you’ll likely spend less time and effort on refreshing and tweaking your desktop files.
Simplified DAX
Simplified DAX
DAX expressions tend to be simpler and more intuitive when used with a star schema. Complex filter arguments become easier to handle and DAX will often be shorter, easier to write, easier to read, and easier to maintain.
Enhanced scalability & usability
Enhanced scalability & usability
Another benefit of star schemas is their scalability. As your reporting needs grow, you’ll find it much easier to incorporate new facts, dimensions, or data items into your existing tables, compared to the cumbersome process of joining OBTs to each other.
Finally, usability is enhanced by making it easier for you and your users to find the fields needed for DAX creation and report builds. In a star schema everything lives in logical tables so it’s much simpler to navigate and locate items in the Data pane, no more endless scrolling through a massive list!
Wrapping up
After reviewing the benefits of star schemas over OBT data models I hope now see the wisdom in steering clear of OBT models unless you’re specifically dealing with a quick, rough draft, or a Proof-of-Concept report.