
This is the fifth in our series on common Power BI mistakes.
You can find the other articles here
Ever been asked to quickly (like in a couple of hours quickly) throw together a report using the data from one of the notorious accounts department’s ‘Cave of Wonders’ spreadsheets?
You open it up and find approximately 300 tabs of pivoted data…Cry. You have my sympathy.
Storing data in this fashion is hardly unique to accounts departments everywhere, however. Pivoted data lends itself to quickly recording the same data repeatedly, so it’s often used for balance sheets and inventory management, and many an online survey tool will allow you to extract all responses into a spreadsheet using this format.
The issue is that it presents an absolute nightmare for running any type of analysis over it in Power BI.
So, what should you do with pivoted data in Power BI?
What is pivoted data?
When data is pivoted, it is organised and stored both horizontally and vertically, think of a shop owner recording the volumes of different items (rows) in their store across many months (columns). Pivoted data is arranged in tables, where each attribute has a separate column, even if representing the same measure.
Common examples of pivoted data include:
- Recording any kind of financial data for multiple ‘things’ such as Products, People or Business units (Rows) and for each month of the year (Columns).
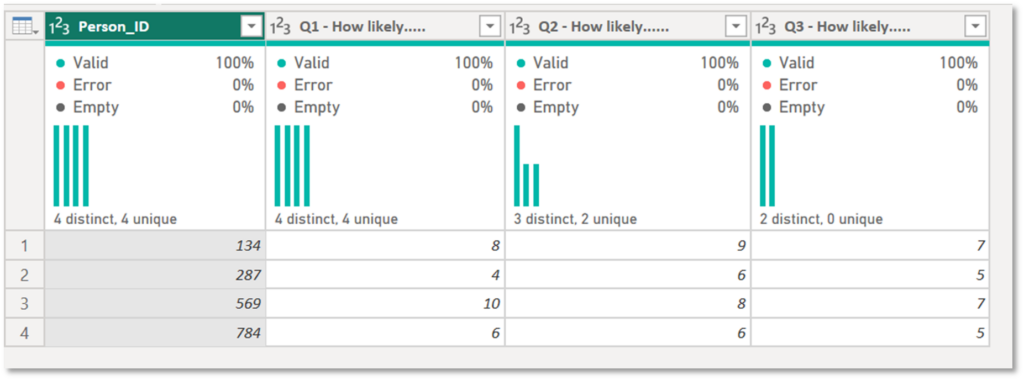
- Survey responses to multiple questions (Columns) by numerous people (Rows), as shown in Figure 1.
The drawbacks of leaving data pivoted in Power BI
Leaving data pivoted will mean you fail to take advantage of the way the Vertipaq engine compresses data for storage within Power BI, boosting performance. And it’ll absolutely lead you into all kinds of DAX-related pain.
Killing Compression
Killing Compression
One of the Vertipaq engine’s party tricks is compressing the rows of a column with identical values. But this simply cannot happen if the values are in separate columns.
In the survey example in Figure 1, there are 8s on rows 1 and 3 that sit in different columns. The rows of these columns cannot be compressed. Whereas the final column can be compressed to two rows (7s and 5s).
Missing out on compressing the 8s will make the model larger and less optimal than necessary. Multiply that effect for each instance of data that cannot be compressed, and it quickly adds up.
Difficult DAX
Difficult DAX
Moving to the front end, the fact the data is pivoted means you couldn’t create a single DAX measure that performs statistical analysis over the responses to the entire survey. You would need a duplicate measure for each and every column you wanted to analyse, and then a pretty clunky measure that collated the results from the other measures.
Moreover, imagine you want to compare to a previous period by running some time intelligence calculations over the data – have fun! How on earth are you going to write a clean and simple yet dynamic year-to-date calculation over 12 columns?
I’m shuddering at the thought of the 12 nested IFs and the ever increasing number of SUMs you would need for this.
Unpivot your data to improve performance and efficiency
A much better option is to unpivot the data – you can use Power Query for this, and you don’t need ninja skills, there’s a simple transformation included in the User Interface.
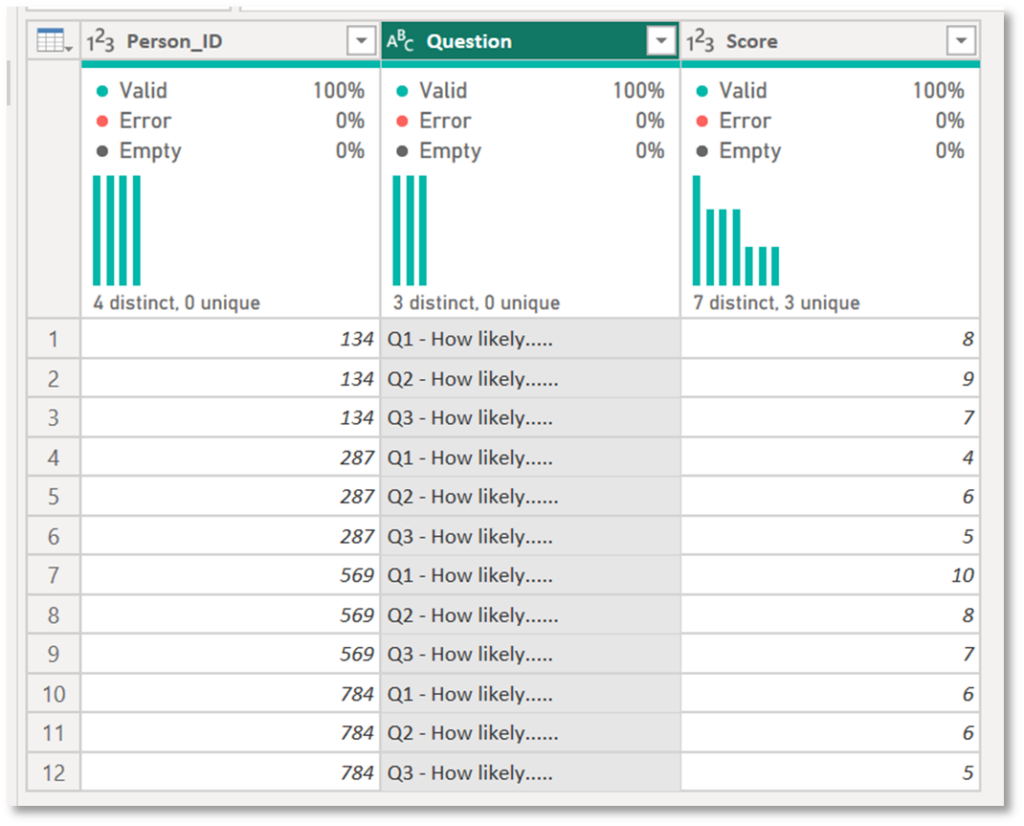
In Figure 2, the same data has been transformed into the shape that allows for a much simpler model and analysis.
As well as taking up less storage space, this makes sophisticated analysis (such as time intelligence or basket analysis) much easier and faster to set up and complete. And it would of course satisfy my (borderline) obsession with performance and optimisation, because the data in the score column could be compressed into seven rows instead of 12.
Wrapping Up
So there you have it – if your data arrives pivoted, make sure you pivot (sorry, not sorry) your approach to unpivoting it before you do anything else. You won’t regret it.