This is the sixth in our series on common Power BI mistakes.
You can find the other articles here
I’ve been looking forward to getting this one off my chest.
The auto date/time setting is one of my biggest Power BI bugbears. It was undoubtedly developed to make the platform more widely accessible, giving people who aren’t clued-up on dimensional modelling and date tables the ability to do quick and easy time-series analysis through multiple grains of time (daily, monthly, etc).
But this setting causes lots of other problems which will block and frustrate you whilst also adding inefficiencies. So it’s well worth spending the time to understand how and why it’s best switched off and forgotten about.
What is the auto date/time setting?
When enabled (which it is by default), this setting automatically detects date and time fields in your data and applies predefined hierarchies to them.
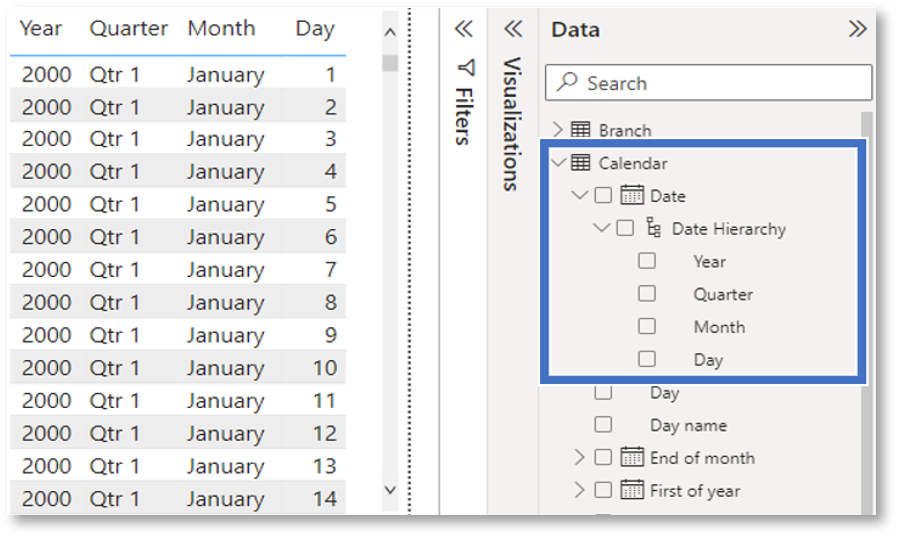
It will give you columns for Year, Quarter, Month and Day for each and every date field in your model, as shown in Figure 1, notice how every date column has a calendar icon next to it, that’s the tell tale sign it’s enabled.
An automatically defined hierarchy sounds convenient, right?
Well, yes, it can be. But as mentioned above, it comes with several costs.
Problems caused by the auto date/time setting
Microsoft have categorised the auto date/time setting as ‘Time Intelligence’. However, I believe the word ‘intelligence’ is hugely misleading in this instance.
This setting forces users into a one-size-fits-all approach that fails to account for the intricacies and demands of each individual analysis. It’s suboptimal for the data model’s performance, and it adds a layer of complexity to DAX.
Hardly intelligent, right?
Let’s unpack the problems it causes:
Restricted and inflexible analysis options
Restricted and inflexible analysis options
Starting right at the top, the biggest of all the reasons to avoid the auto date/time setting (and the main source of my ire) is that it locks you into such a limited amount of analysis possibilities. It only really works if you have a single table with a single date column. And if you’re sat there thinking, “it’s fine, I’ll just customise it”, well, no, you won’t even get a sniff.
Consider the following scenarios:
- Would you like users to filter data by different dates? (An order and return date, for example.)
- Fancy doing a bit of forecasting?
- Do you need to analyse your data by weeks?
- How about showing trends by financial year?
- Would you like to create reports showing the previous year’s sales, or the rolling average of sales across a specified period – something requiring real time intelligence?
- Any desire to view data from different fact tables against a single date column – e.g. to look at both orders and purchases for a particular month?
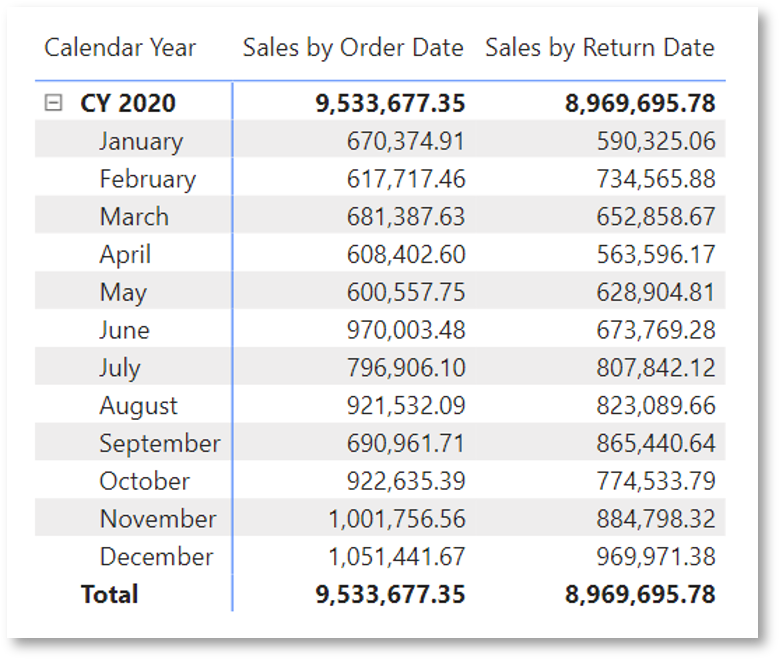
- How about viewing data from the same table, with two different dates, against a singular time period? For example, say you want a report of monthly sales with two columns side-by-side showing sales by order date and return date respectively (see Figure 2 – created with auto date/time switched off).
I’m afraid if you’d like to do any of these, you’ve not been considered by the auto date/time setting and you’ll have to find other solutions.
Bigger data models
Bigger data models
The second reason I have beef with this setting is that using auto date/time makes your data model bigger – so it takes up more storage space and can slow down performance.
Unbeknownst to most users, the way Power BI creates these hierarchies is by bolting on a date table to EACH and EVERY date column in your model. You can’t see them, but trust me, they are there.
Actually, I can prove it. In Figure 3 I have hooked up DAX Studio to a PBIX file. Lo and behold, there are those pesky tables hidden away from view like Hugo Simpson.
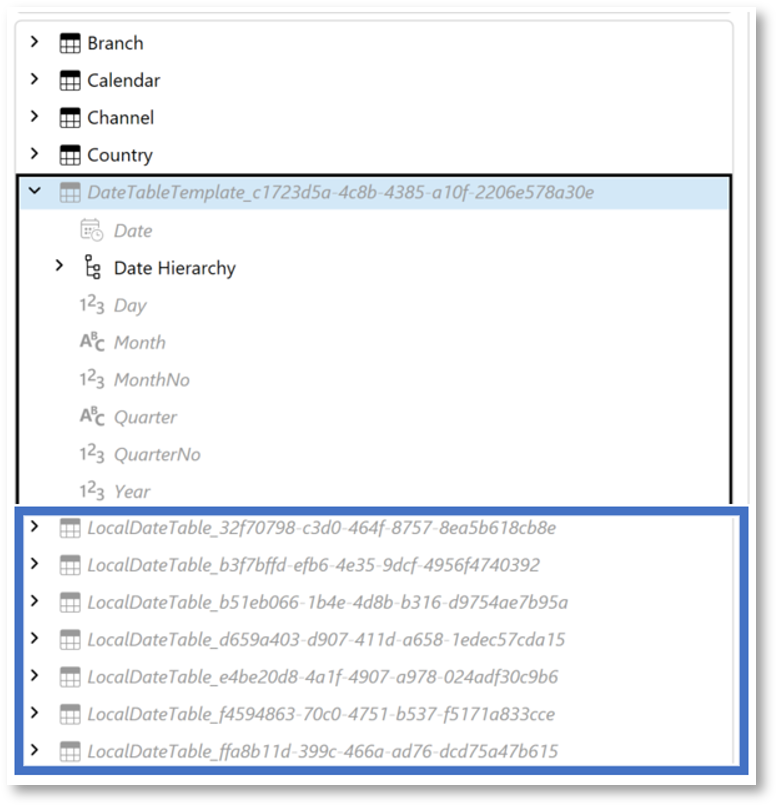
There’s more. Power BI also adds extra hidden columns in those hidden date tables. In Figure 3, under Date Hierarchy, you’ll notice a couple more columns than those surfaced in the hierarchy: MonthNo and QuarterNo. Both are used for sorting their respective text columns (seen in Figure 1) into the correct order.
You have no control over which date fields Power BI does this for. It’ll just do it for all of them, whether you need it or not. This will of course increase the amount of data in your model, and therefore its size.
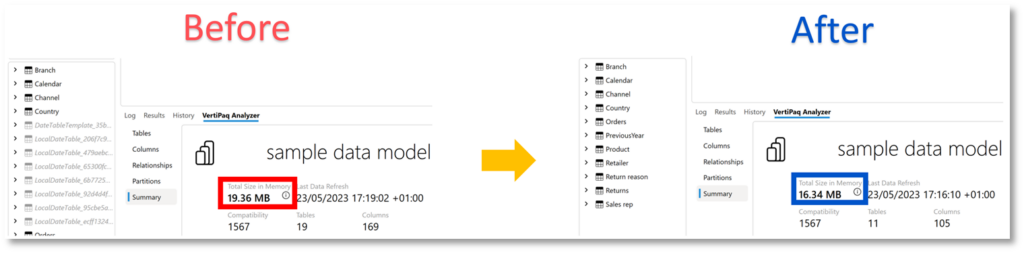
Figure 4 shows how much space can be saved by comparing the example model’s metrics before and after turning off auto date/time. The model size has decreased by 2.82 MB – a whopping 14.57% reduction just from changing one setting.
The reduction size is obviously dependent on the number of date columns in your data, and their date ranges. But for models of many gigabytes, adjusting this setting can significantly impact size and performance.
Added DAX complications
Added DAX complications
And finally, coming in at number 3 in ‘the reasons I dislike this setting, and encourage you to turn it off, forever,’ is the complication it adds to DAX when referencing a date column.
Pop quiz: What are the items you can reference in DAX?
If you answered a table, a column, a measure and a variable (VAR), you’d be incorrect. Because with auto date/time enabled, you also need to reference a level of the date hierarchy when adding it to a DAX function.
Say you want to look at cumulative profit during a specific period. In this example, we’re going to use 6th-13th January 2021.
You can use the DAX function TOTALYTD (total year to date) to evaluate this.
When auto date/time is enabled, you have two options for displaying this calculation. You can either show the result against each date in the date column (in this example, the chosen days in January 2021), or you can use the auto-generated columns detailing the year, quarter, month and day. As I’ll show, this is the only choice that will give you the correct figures, but maybe not the way you want to present them.
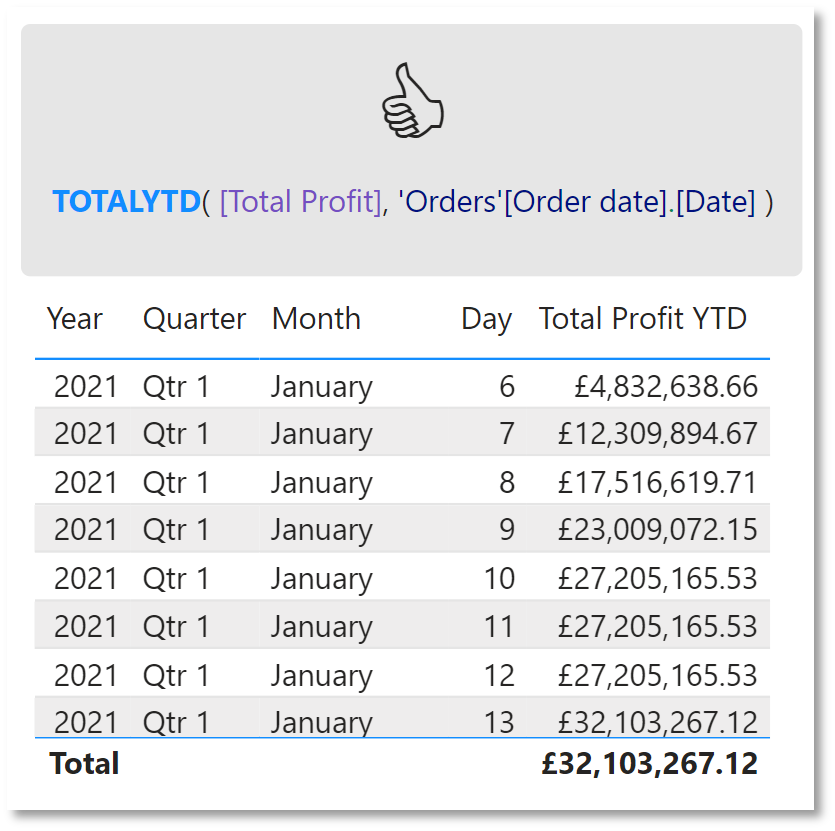
Let’s start with that radical idea of showing the correct result, and how you’ll achieve it with auto date/time enabled.
To properly display profit cumulatively, you must add a reference for the name of the hierarchy level that Total Profit is evaluated over (in this case, Date). This is in addition to Table and Column, from which the hierarchy level must be separated by a full stop, so in this case we end up with:
If this seems pretty unfamiliar, that’s because it is. You won’t see this syntax anywhere else in DAX.
Want some more? As Figure 5 shows, your measure must be displayed against the levels of the hierarchy.
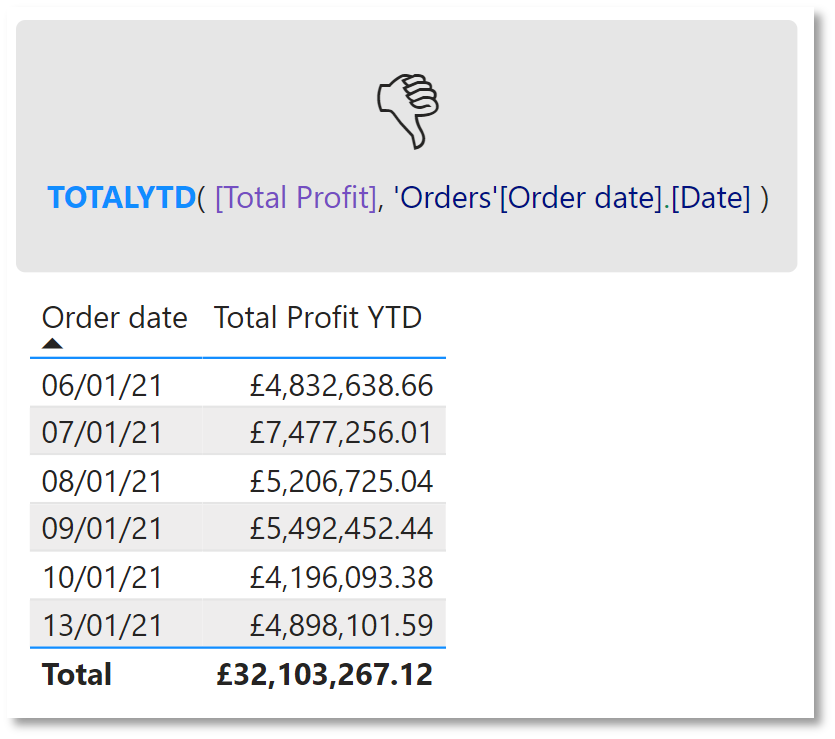
But what if you don’t want all those columns, and you just want to display cumulative profit for each date in the range?
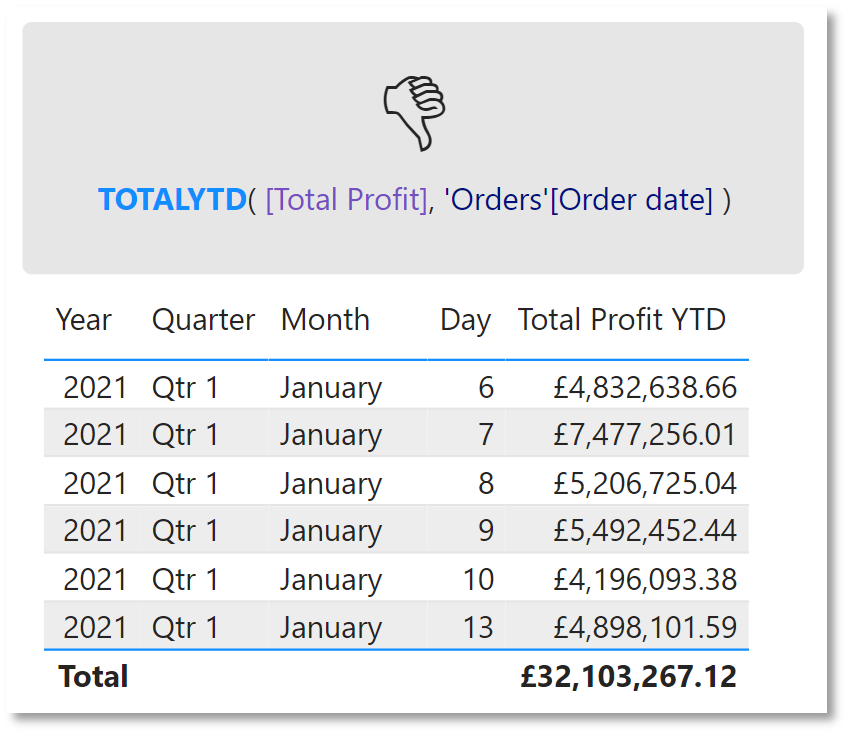
Well, this syntax will give you the wrong answer. Notice how in Figure 6 total profit is not shown cumulatively. Instead, total profit for each day is shown – and days where no profit was made are excluded.
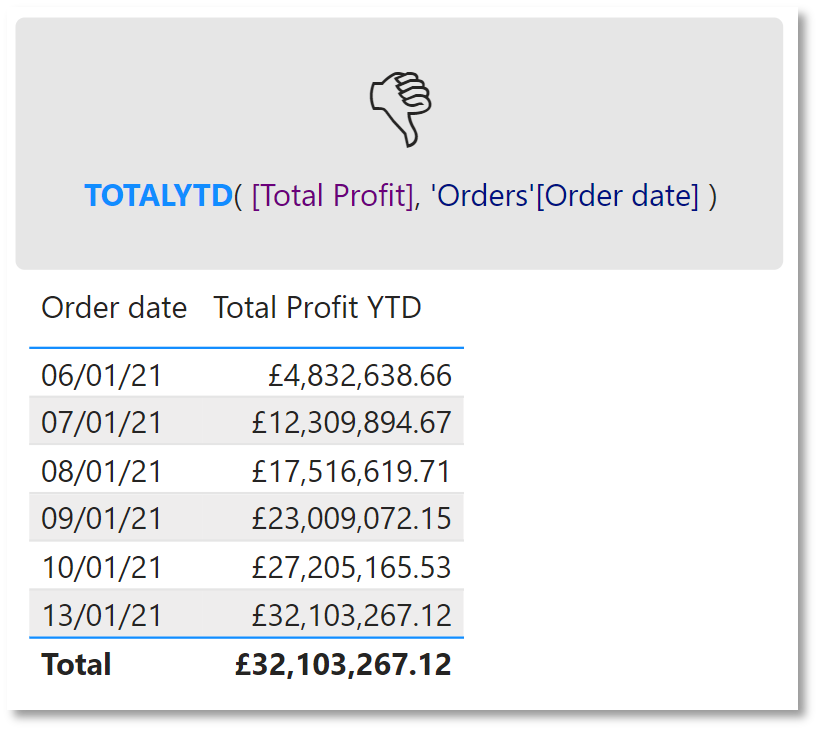
So, you conclude the problem is this weird and unfamiliar DAX syntax, and remove “.[Date]”…
Nope, still incorrect. But only if you look carefully.
Figure 7 does show profit cumulatively – yet still excludes non-profit-generating days. But just because no profit was made, it doesn’t mean all profits from previous days were magically lost, only to reappear on the next day that generated profits.
Now you’re thinking, “My DAX is the syntax I’m familiar with. What happens if I add the columns of the date hierarchy back in…?”
Wrong again.
In fact, this is the most wrong it has been. Now you’re back to only showing the individual days’ profits AND against all those columns you did not want to show in the first place (see Figure 8).
So there we have it, you’re locked into displaying data in a way you didn’t want to, all because of one setting.
Actually, before I move on, there’s one last problem worth mentioning. What if, because you’re not familiar with this syntax, you pick the wrong level from the date hierarchy?
Well, your visual won’t work. And you’ll get a particularly unhelpful error message:
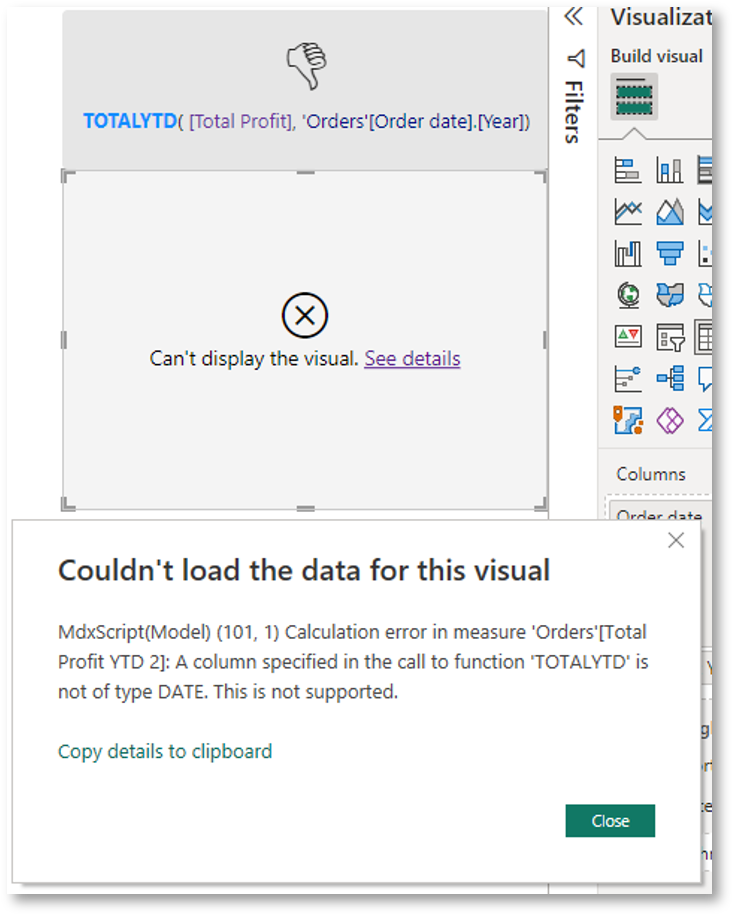
To this error message, I would like to point out that I have in fact chosen a column ‘of type DATE’. But you’ve made me pick a level of a hierarchy in a linked table I didn’t even know existed, and I just so happen to have accidentally picked a level that’s not formatted as a date.
Let me emphasise again: this syntax does not happen anywhere else in the DAX language. You’ll only ever need to get your head around it if you have the auto date/time setting turned on.
A better alternative to the auto date/time setting
Rather than using auto date/time, add a Date or Calendar dimension table to your model in one of these three ways:
Use CALENDAR and CALENDARAUTO DAX functions
Use CALENDAR and CALENDARAUTO DAX functions
These make creating a date table nice and easy. (But please don’t add calculated columns to it for transformations, as you’ll ruin the compression that calculated tables benefit from. Instead, wrap one of the calendar functions in an ADDCOLUMNS when creating the table.)
Use Date and DateTime M code functions
Use Date and DateTime M code functions
There are a plethora of amazing Date and DateTime functions in M that make building custom calendars a doddle. I’ve written M code to handle ISO weeks, bizarre financial years, splitting a year into 13 periods, and to add a flag for BST (which I then used to shift NOW() forward an hour for reports held on the server which will use UTC).
Import a custom calendar
Import a custom calendar
Use a customer calendar that’s held in one of your databases and is used across the organisation.
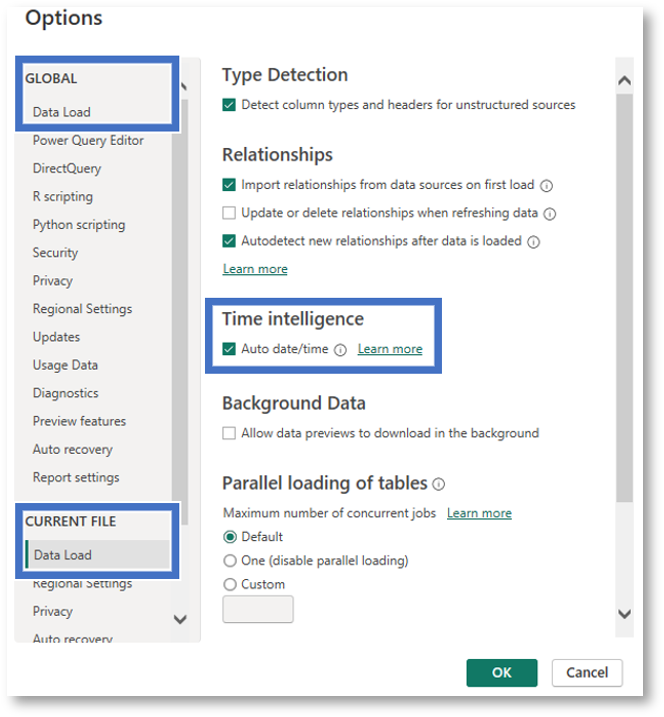
Finding the auto date/time setting
To use any of the approaches above, don’t forget to first turn off auto date/time.
You will find it switched on by default in both the Global and Current File options for Data Load, under the Time Intelligence header shown in Figure 10.
Wrapping Up
Next time you find yourself starting a Power BI model, and notice a calendar icon next to all of your date columns after importing your data, please remember this article. I’m hopeful you’ll find yourself in Options and Settings disabling the auto date/time tick boxes.