This is the eighth in our series on common Power BI mistakes.
You can find the other articles here
Row and filter context are pretty much the first two things you need to get your head around when learning DAX. (The fact it’s taken me until the 8th article in this series to cover these two fundamentals just shows how much there is to learn with Power BI.)
Entire book chapters have been devoted to row and filter context, yet many people still don’t understand them properly. I should know: I didn’t know about them from the start and it took me a good two years filled with painful hours of guesswork writing DAX calculations – like someone stumbling through an obstruction-filled dark tunnel – before I finally understood fully how to control filter and implement row context.
So trust me when I say that failing to understand how to control and use row and filter context to your advantage will lead to endless head scratching and sleepless nights over why your latest measure gives you incorrect totals, unexpected results, or takes forever to provide an answer.
My moments of enlightenment came from reading and understanding these excellent articles from SQLBI on Row context and Filter context, and you should read them too. But not before you have finished here. They are quite technical and can be a little hard to follow, so as I take you through my understanding of these beasts and how you can tame them, I have done my best to make some of the key points from SQLBI a little less complex.
Row Context
I’ll start with the easy one (to explain, that is). Row context refers to the context provided by the current row during a calculation.
As I mentioned in an earlier blog in this series, calculated columns have row context. This means that whatever DAX you provide will be calculated row by row.
So if your DAX consists of: multiply column A by column B (A x B), this is exactly what the column will do within every single row of the table (see Figure 1). Calculated columns have access to the individual values of A and B in each row, because of row context.

See, I told you it was easy…
…Except it’s not entirely that easy, sorry. Although I’m talking about calculated columns here, it’s only to help you understand row context. I recommend avoiding using them (unless strictly necessary) and using measures instead.
Measures, by default, do not have row context. They do not sit at the column level of a table. Instead, they reside independent of these (think of them as floating, cloud-like, above your table) and are designed to be calculated at an aggregate level.
Consequently, measures don’t really know what the rows of a table are, cannot access the values of a column individually, and certainly do not know which ones to choose unless specifically told.
Why lack of row context leads to problems with aggregate functions
Why lack of row context leads to problems with aggregate functions
Aggregate functions look at all the values in a column (or a set of values if filtered), and return a single figure depending on the aggregation (or summarisation) chosen. They therefore only accept one input – the column you wish to summarise.
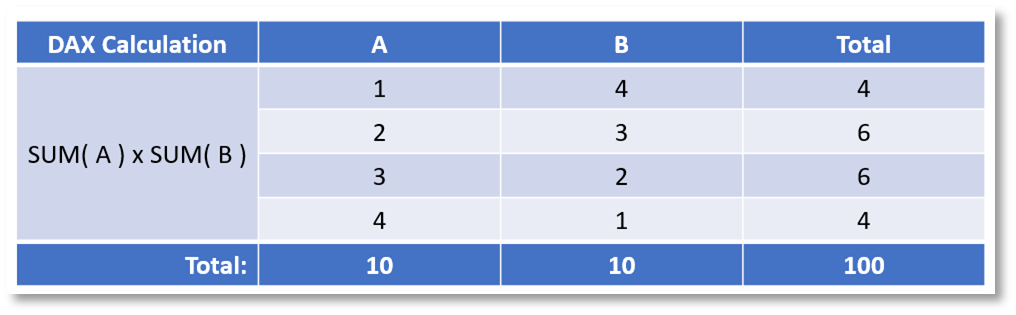
Due to the default lack of row context, measures use aggregate functions (such as SUM, AVERAGE, MIN, MAX) to perform calculations. However, these add extra complexity when looking to instigate row context. Following our earlier example of multiplying columns A and B, in Figure 2 I’ll use SUM( A ) x SUM( B ) to illustrate this.
Because there is no row context this calculation will multiply all the aggregated values of column A by all the aggregated values of column B to generate an overall total figure.
At the individual row level, the figures are correct (1 x 4 = 4 etc). But at the total level we see a figure that simply cannot be correct (4 + 6 + 6 + 4 ≠ 100). In this instance, because the aggregations are being performed over the columns (1 + 2 + 3 + 4 = 10 etc) then multiplied (10 x 10 = 100), we end up with a nonsense total that will leave your stakeholders picking up the phone to complain.
Using iterator functions to provide row context
Using iterator functions to provide row context
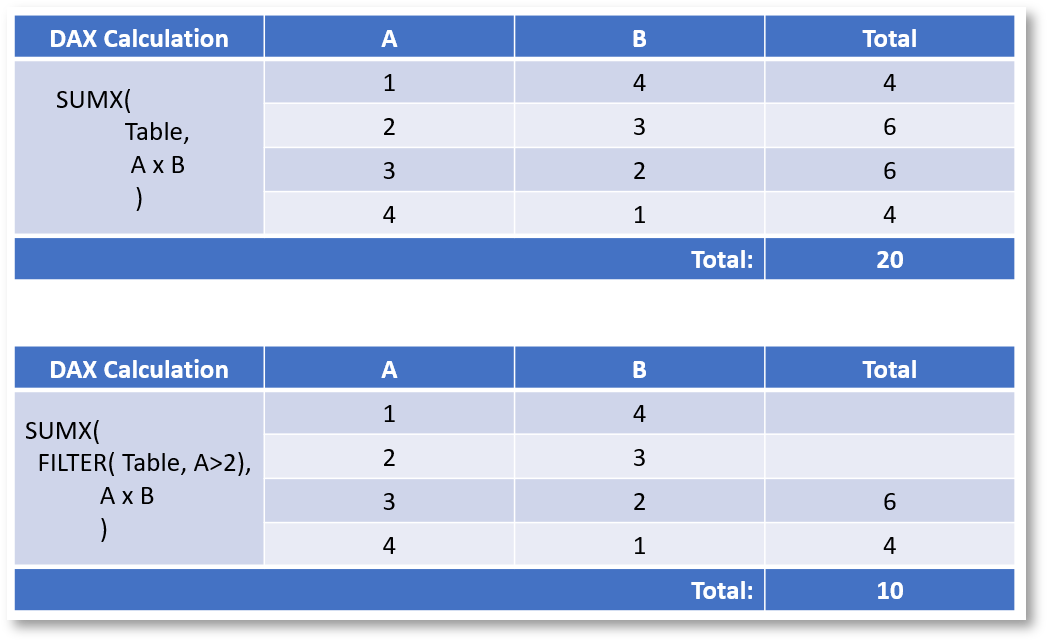
This problem can be fixed by using iterator functions (such as SUMX, AVERAGEX, MINX, MAXX, FILTER), which provide row context.
Iterator functions perform a calculation over each row of a table. This table can be a bricks-and-mortar table from your model, or created virtually using other DAX functions. It therefore requires two inputs: a table to calculate over and an expression to perform on each row.
The first four iterator functions listed above force the calculation to be run at an individual row level by iterating over the table provided as part of the syntax. FILTER is a little different. It can be used to create a smaller virtual table for the calculation to iterate over – therefore providing row context within row context.
The effect of iterating functions can be seen in Figure 3. The bottom table shows the true effect of controlling row context, with a basic example of how you can specify which table rows a measure should calculate over.
Filter context
This is the sneaky one.
On the face of it, filter context is easy to understand. You could take the description of “the filters being applied to the data model” pack up, go home and consider yourself an expert.
But once you start writing advanced DAX calculations, figuring out exactly where in your statement filters need to be applied, or why your are getting incorrect results can be like herding cats, and this is filter context in action.
(Especially if you share my penchant for elegance and like to torture yourself by attempting to write everything in one measure, when you know darn well staging various elements across multiple measures will absolutely work).
In essence, filter context refers to the filters that are active on any particular data point when a query returns data. But, we’re not done yet…
Filter context presents at a cell (or data point level), but operates at the model level. This means that when applying a filter it affects the specific column and its table, and all the tables it can reach through one-to-many relationships.
What’s more, should your query touch a table with a bi-directional relationship enabled (but you wouldn’t dare commit this heinous crime, would you?), this will also affect items on the “one” side of this relationship too.
At this point we probably need an example to aid understanding.
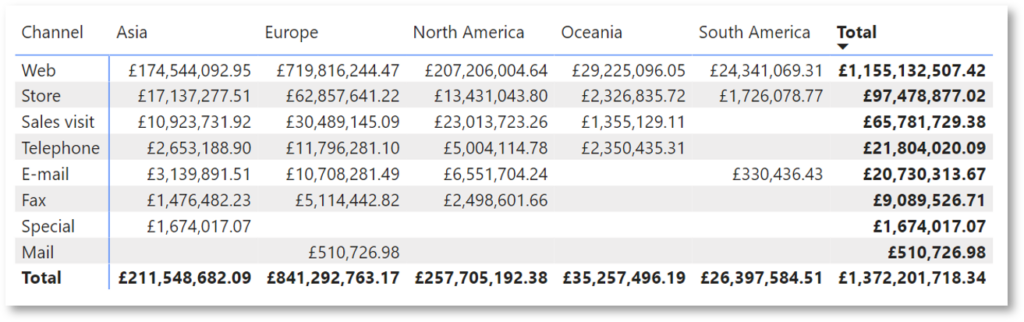
In Figure 4, I’ve placed a measure against two columns (Channel and Continent) from different dimensions of a star schema model, both of which filter the Order table through their relationships.
The non-total figures within each cell are being calculated via the intersection of the values of the Continent column and Channel row being placed into the filter context on the Order table. Put another way, the non-total cells have a filter context from the values of Continent and Channel.
The totals, however, only have one filter applied to their filter context, depending on whether they are providing a total for each Channel or Continent.
It is all the same calculation, but every figure within the table has a different filter context applied.
Don’t confuse filter and row contexts
Don’t confuse filter and row contexts
A common misconception is that the cells of a Matrix or Table visual have row context, not filter context. Remove Continent from the table in Figure 4, for example, and we would be left with a breakdown of Sales per Channel (the totals at the far right of the visual). The reason there would be no row context active here, is that there could be many Websites or Stores within the Channel table. Consequently, there isn’t a single row specifically dedicated to Web or Store. There is a filter context that adds these into the calculation and aggregates the individual values of each of them.
Manipulating filter context
Manipulating filter context
Filters can be applied to queries in many ways, including visuals and their interactions, the filter pane, slicers and DAX. Users of your reports can control filter contexts by making selections in all of these but DAX.
DAX is where you as model owner can play God and control the filter context for the end user. Just remember what William Lamb, Winston Churchill and (get ready, Spider Man fans) Uncle Ben said: if you accept the great power of manipulating filter context then you must also take on the great responsibility of producing reliable figures for your users….or something like that.
In most cases, this means understanding the type of filter required, and where in a DAX statement or set of branched statements they should be applied.
Teaching you this is beyond this blog’s remit. What I will do, however, is introduce the most common method of manipulating filter context, because a helping hand is always a lovely thing to offer.
CALCULATE is a nifty bit of DAX which I’m sure you’re aware of, but very few people understand what it does. It allows for the removing, restoring, and setting of new filters using specific values of a column or columns within an expression, AKA it allows you to manipulate the filter context. This is handled through a number of modifiers, including: USERELATIONSHIP, CROSSFILTER, ALL, ALLEXCEPT, ALLSELECTED, ALLNOBLANKROW, KEEPFILTERS and REMOVEFILTERS. Each serves a specific purpose depending on the desired outcome.
The type and location of filters required is always situation dependent. You will garner this knowledge through hours of self-directed learning, trial and error.
Wrapping Up
I hope the above has proved why it’s worth investing time and effort in understanding row and filter context to leverage in your reporting. (And shown why those ‘dashboard in a day’ courses are completely insufficient for anyone wanting to use Power BI at a level beyond simply recreating your accounts department’s famously huge Cave of Wonders spreadsheet.)
At the time of writing, I’ve been working with Power BI for 6 years, and the chances of me nailing a complex DAX statement the first time are still pretty slim – usually due to the presence of row and filter context.
So I implore you to begin reading about and understanding them now, and don’t stop until the day you create your last Power BI model and report.