This is the second in our series on common Power BI mistakes.
You can find the other articles here
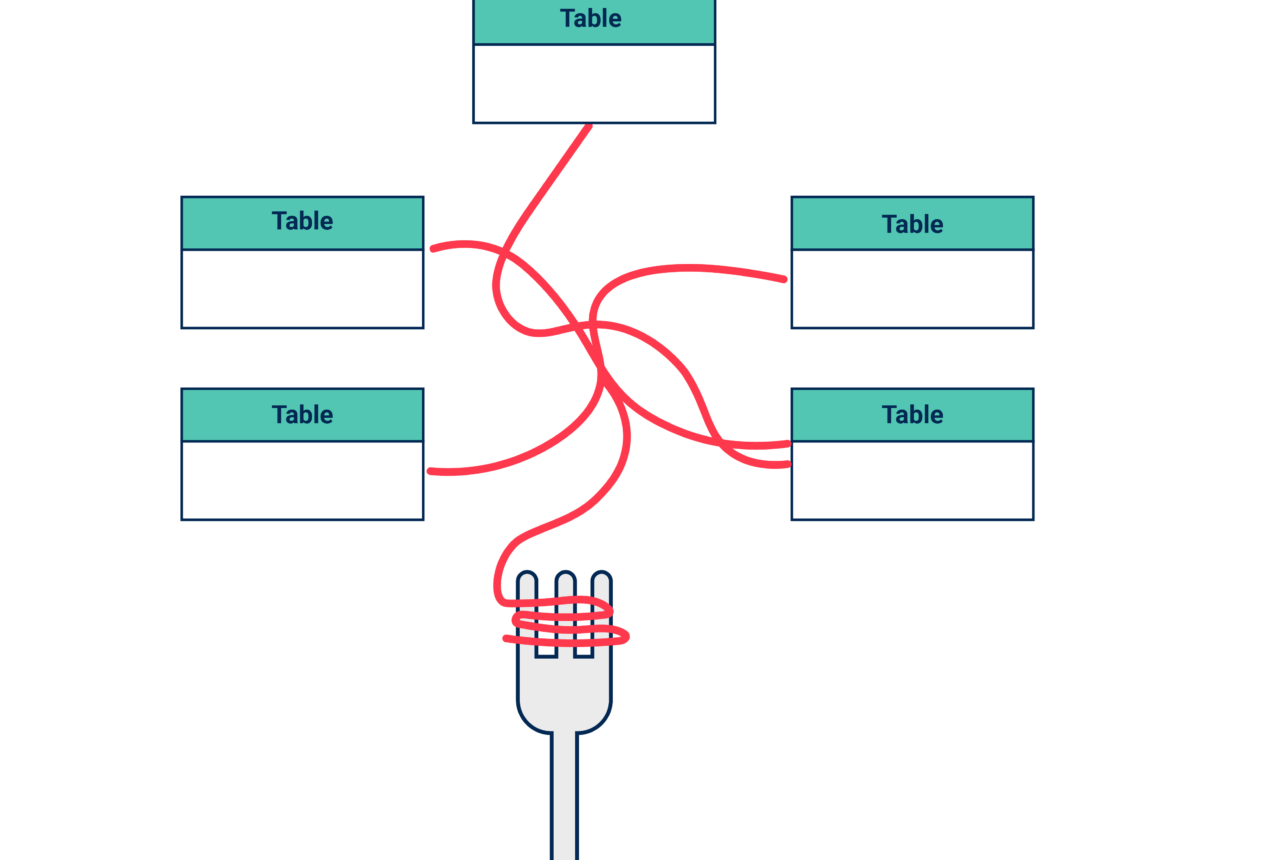
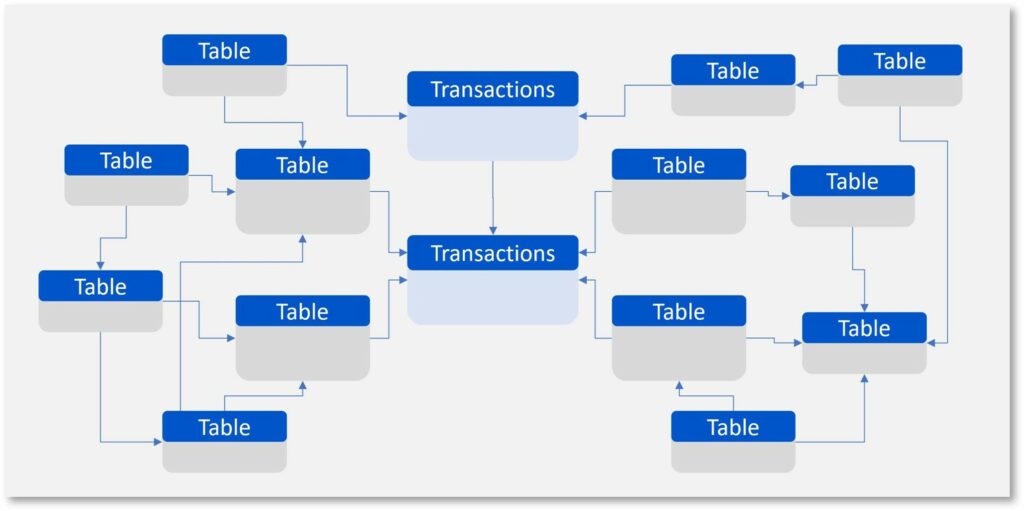
At the other end of the scale to One Big Tables are what I like to call Spaghetti Junction data models. These are created by importing and connecting every single table from a relational database without clear thought for the direction of travel for filters — resulting in an overly complex tangle of tables which hampers usability and performance.
Figure 1 shows an example of a spaghetti junction model. This model makes sense for a transactional database, which aims to minimise the impact of change . However, it is not an ideal basis for reporting.
Generating useful reports from this model poses significant challenges for two user groups:
- Report builders would find it difficult to navigate and locate items within this model. They might find that the items they need to slice by are not joined up properly to their event data, and they would also have to write very complex DAX calculations to obtain the desired answers. So the modeller might chuck in another relationship, overcomplicate a DAX measure with a virtual relationship, or worse, create a calculated column to help the user. All of these solutions would just be papering over the cracks of an overcomplicated model — cracks which become crevasses when considering that this kind of model also leads to slow and perhaps inaccurate reporting.
- Report users would experience slow-loading reports, which may also contain incorrect data.
What is DAX?
Data Analysis Expressions (DAX) is a formula expression language and query language used in Power BI and other Microsoft products. DAX allows users to conduct advanced and custom calculations and queries on data in tabular formats. It is commonly used for tasks such as creating calculated tables, and generating insights from data through defining complex calculations in measures.
Read more
Improving a spaghetti junction model for Power BI
To transform a spaghetti junction into an effective model for Power BI, you need to denormalise the dimensions. In other words, the opposite approach to optimising an OBT.
Before and after denormalising the dimensions
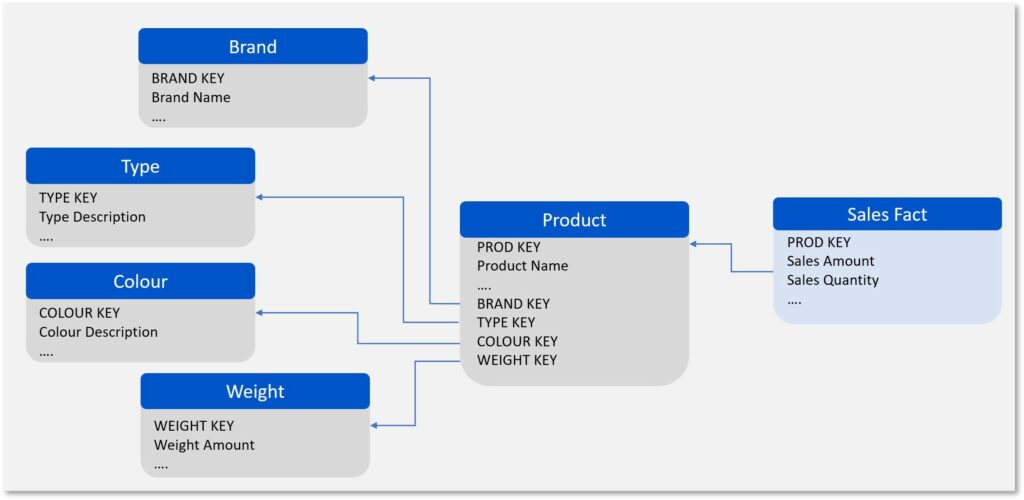
In the model in Figure 2, descriptive product attributes (dimensions) such as Brand, Colour, Type and Weight are each in their own table, which is joined to a Product table. This is not an effective model for Power BI.
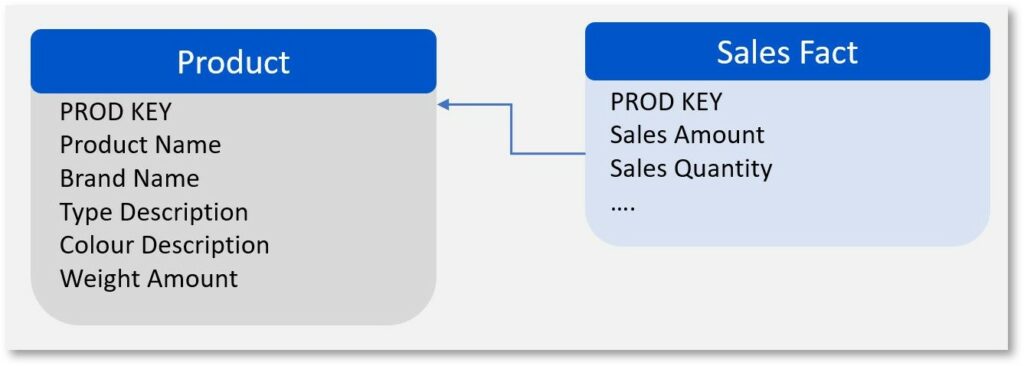
Conversely, Figure 3 shows a well-designed model optimised for Power BI. All of the product attribute tables are combined to form a single Product table.
The benefits of untangling a spaghetti junction model
Denormalising dimensions in a spaghetti junction model leads to several benefits in Power BI:
Improving user experience
Improving user experience
Denormalising dimensions in a spaghetti junction model makes life easier for Power BI users, as it’s much simpler to find an item in one table rather than searching through five.
Enhancing performance
Enhancing performance
Say you wanted to know the sales figures for red, four-man tents made by Canopy. Using the model in Figure 4, Power BI would have to jump through four different relationships to retrieve data for this one query. This slows down performance, which can be frustrating for end users sitting staring at the infamous spinning wheel.
The same query would be much faster after denormalising the dimension data, as in Figure 5. This is because any calculation filtered by multiple product attributes now only needs to traverse one relationship in its query.
Simplifying DAX calculations
Simplifying DAX calculations
Similarly, denormalising dimensions in this situation simplifies the filtering conditions in DAX calculations. Creating a measure from the combined Product table in Figure 5 requires conditions from a single table to pull the sales figures.
Before, when the tables were separate, the DAX would require multiple, separate filter conditions. This makes it more complex, demanding more optimisation, due to the many different ways of writing DAX filters.
Preventing ambiguity
Preventing ambiguity
Incorrect results are the most severe of the impacts from overly complex models, often arising from ambiguity. This is discussed in detail in my riff on bi-directional relationships. Here, I highlight a scenario where Power BI can detect ambiguity and force you to simplify your model.
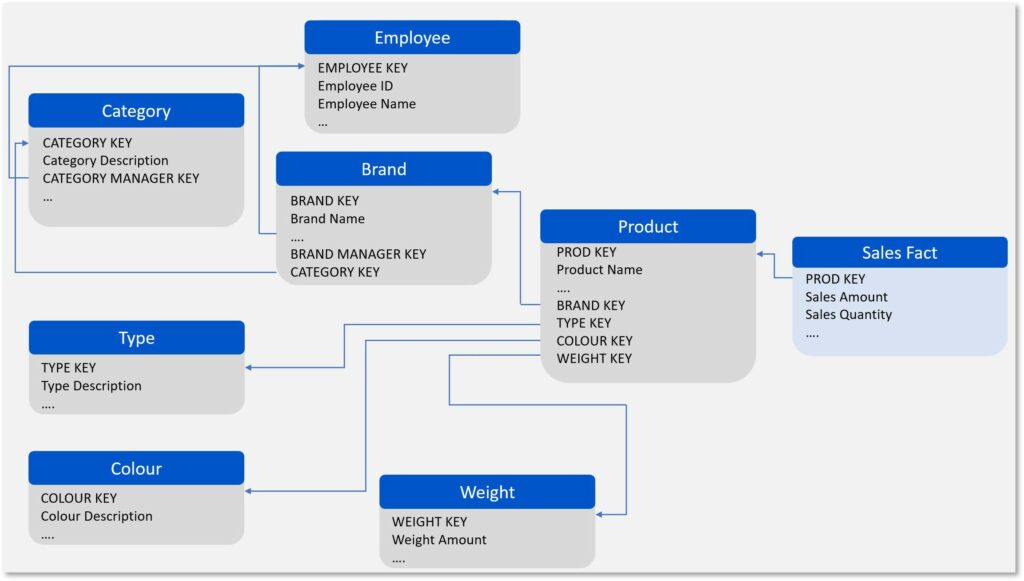
In Figure 4, the model from Figure 2 is expanded by adding Category and Employee tables, both of which filter Brand. However, Employees can own Categories, so there is a relationship between these tables also, yet when Employee tries to filter Category, Power BI will tell you no.
If you attempt this configuration, one of the three relationships will need to be inactive to avoid ambiguity. Trying to make it active results in an error. This is great from the perspective of ensuring the integrity of your data model, but not so great if you were hoping to pack up and leave work early, as you’ve now got a problem to solve.
This inactive relationship isn’t really a solution. It prevents direct filters between tables, and to activate it, you’d need DAX measures. These measures might be made purely to enable slicers, adding complexity. Furthermore filtering on Sales would still have another two relationships to jump through, resulting in slower queries.
A more efficient approach would be to consolidate these tables into a single Product table for clearer filtering, simpler report creation, and fewer headaches all round.
Wrapping up
Confusing and frustrating for Power BI report users and builders alike, I think we can all agree spaghetti junction-style data models should be firmly kicked to the kerb.

