This is the ninth in our series on common Power BI mistakes.
You can find the other articles here
So, you’ve hooked up and manipulated your data, and organised it into a beautiful star schema.
You’ve created a load of DAX measures, and used these to populate the necessary fields to make wonderful visualisations that tell your stakeholders exactly what they need to know.
Your report is ready for release, and you’re a Power BI Rockstar, right?
WRONG.
Did you test and optimise your DAX measures?
You didn’t? Well, neither did 90% of other people who use Power BI for reporting – but that doesn’t mean they’re in the right. (Ask them how right they were when their executive stakeholder calls them at 5pm to moan about a slow-loading dashboard with incorrect figures.)
Testing is a crucial step if you want to ensure your numbers are correct and being returned in the speediest and least labour-intensive fashion. And it needn’t be onerous — just add on a bit of extra time for this step when testing the figures your DAX produces against the raw data (you are already doing this, right?!).
Problems resulting from not testing and optimising DAX
Problems resulting from not testing and optimising DAX
With DAX (as with any coding language), there are many ways to skin the same cat. Some will produce an optimal query, whereas others won’t.
Inefficient queries have a nasty habit of leaving your users waiting for answers, staring at the spinning wheel. As an added bonus, they will also clog up a Premium Capacity and potentially hinder other data model queries and refreshes.
So it’s vital to test the efficiency of your DAX once you’ve written a measure with any kind of filter or data checking.
Now, unless you want to go down the route of learning how to understand a DAX query plan, this can take a fair bit of trial and error. However, I believe this trial and error is totally worthwhile as it will vastly improve your knowledge of the DAX language as you iterate through many different options.
The best approach to testing and optimising DAX
The best approach to testing and optimising DAX
Fortunately for those aspiring Rockstars among you, Power BI offers the perfect starting point for optimisation: the Performance Analyzer. (Which is one of the least likely names to be included in the same sentence as the word ‘Rockstar’ and contains a ‘z’ because, well, American product.)
After several previous location changes, Performance Analyzer has now found a permanent home in Power BI’s desktop app under the Optimize tool bar, along with other handy tools.
The Performance Analyzer allows you to refresh every visual on a page at the same time, whilst recording the load times in milliseconds for:
- DAX query
- Visual display (time taken to build the visual)
- Other (in essence, the amount of time that visual has to wait for other items on the page to load).
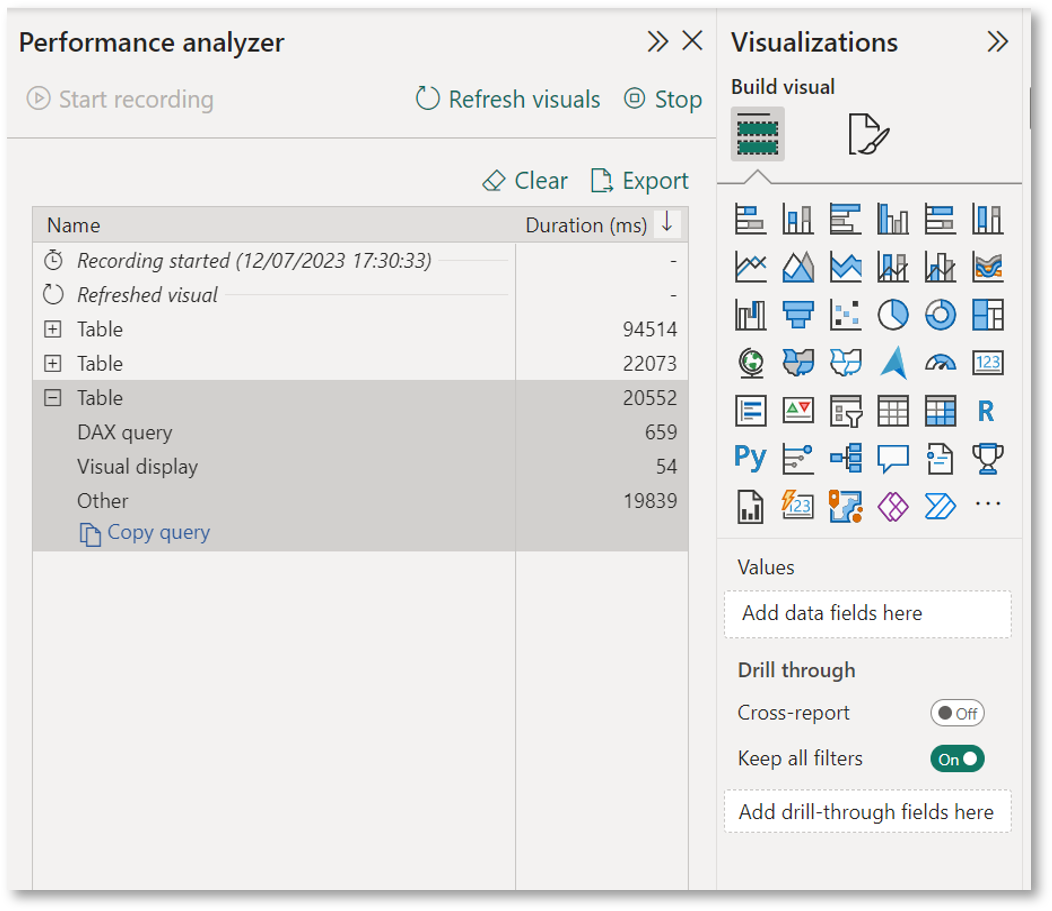
Where it gets exciting is that you can test and amend your measures using a real-life dashboard situation by triggering a refresh of the visuals whilst recording. If you copy the query this not only contains the DAX from your measure, but also the columns shaping your visual and all the applied filters.
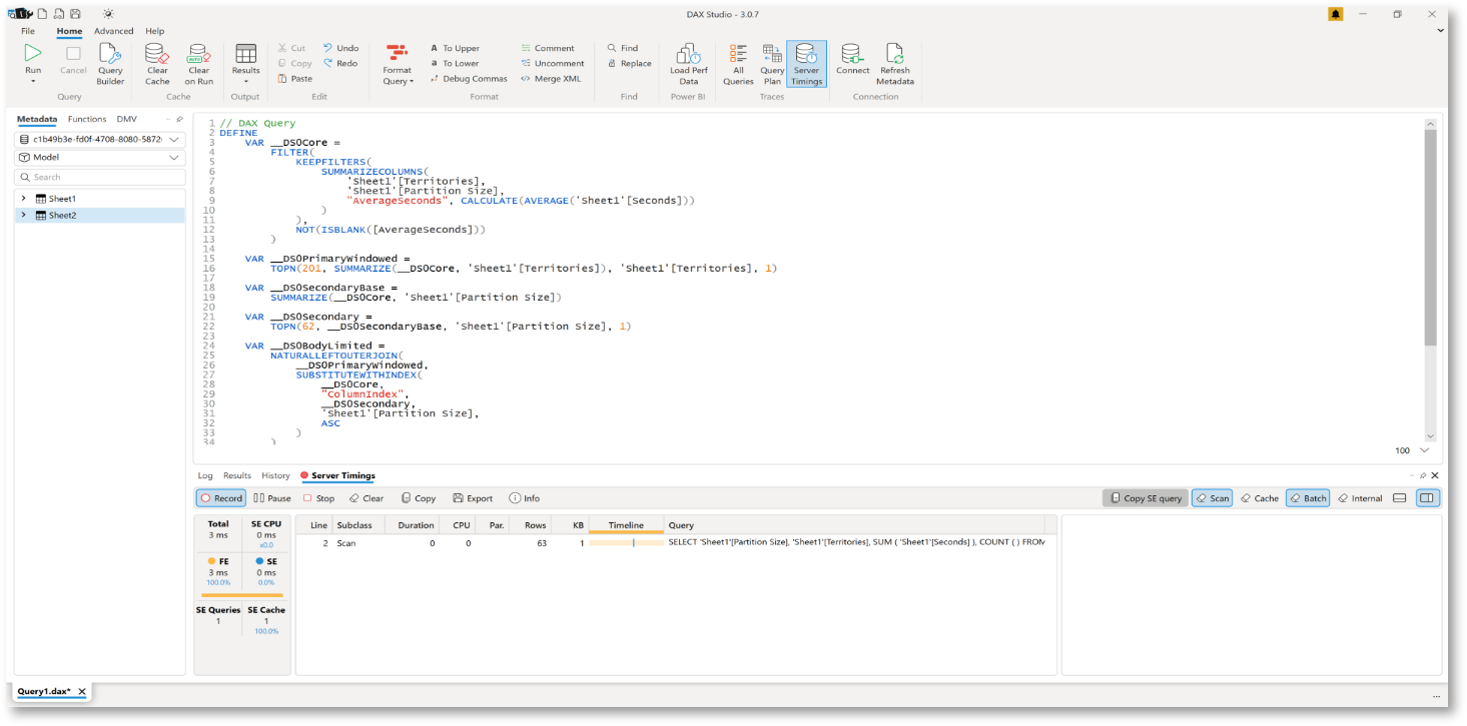
DAX Studio is then employed to run this query away from the dashboard. With Server Timings enabled it’ll provide loads of in-depth information, such as:
- Total number of milliseconds it took to run
- Amount of storage engine CPU time used
- Actual queries run by the Vertipaq Engine
- Number of Storage or Formula engine queries run to achieve your result.
It’s not essential to understand what all of these things mean. It’s perfectly acceptable to alter the DAX and re-run the query (with ‘Cache Clear on Run’ enabled) to monitor the effects on query times.
While checking query times, you can also ensure your new measure’s results remain the same, as DAX Studio presents these results in table format. Confirming your new calculation still produces the same outcomes is obviously essential before releasing it to your stakeholders.
If you’d like to check out more options in this process I can recommend this video from GuyInACube.
Supplement your learning via the trial-and-error method with some reading about DAX to help you establish what various combinations of DAX modifiers will do and how they impact queries.
For instance, there is a lot to understand about ALLSELECTED. I’ve seen many DAX examples, from the Microsoft Community to YouTube videos, using this function unnecessarily and slowing down the query. Although the correct results are returned, a better understanding of ALLSELECTED’s function and knowledge of what to use instead could significantly speed up the visual load time.
Wrapping Up
If you’re not yet acquainted with DAX Studio, there are some excellent guidance videos to be found here and here, and you can download it from here. I seriously suggest you look into using it in combination with the Performance Analyzer for measure optimisation. The days of your stakeholders moaning about the length of time it takes their report to load will slowly be consigned to the past.
And once you implement this as part of your process for releasing data in your organisation, you and your colleagues will join the 10% that can legitimately consider themselves Power BI Rockstars.