This is the fourth in our series on common Power BI mistakes.
You can find the other articles here
How often can you generate the analysis and reporting your business wants without having to transform your data in some way from its current state?
We’re talking about things like writing business logic, removing unwanted characters from a string, or multiplying two columns together.
“Almost never” is the answer you’ve likely said to yourself. Analysis-ready data is a unicorn. So it’s important to understand that some ways of transforming data are far more efficient and user-friendly than others.
Two common mistakes made when transforming data in Power BI are:
- Using calculated columns
- Using far too many steps in Power Query
Before we continue, it’s important for me to acknowledge there are some valid reasons for calculated columns, such as staging parts of an advanced calculation. So I’m only focussing on the misuse of them here.
The drawbacks of calculated columns for transforming data
You probably won’t be surprised that performance is the main reason I encourage you to push transformations as far away from calculated columns as possible. In my earlier article on the One Big Table approach I briefly mentioned the Vertipaq engine’s compression algorithms, and they come into play again here.
Compression saves storage space, resulting in faster data model refreshes and DAX calculations.
However, calculated columns are built after the table they reside in has been processed. This means they don’t benefit from being part of the row sorting process used by the engine to optimise compression.
So, because calculated columns aren’t compressed in the same way as columns created in Power Query, they take up more space – reducing performance.
Compounding the issue, calculated columns are processed in sequence, not in parallel (unlike their native friends originating in Power Query). Processing them one by one ensures that any calculated columns referencing another one are updated in the right order. But it also slows down data model refreshes even further.
What should you do instead of calculated columns?
Write your calculations as a DAX measure
Write your calculations as a DAX measure
Calculated columns have row context because they sit in tables of data. Because of this, they are also often used to produce figures requiring row context (meaning the calculation is performed on each row of the table it resides in).
Because calculated columns take up more space and slow down refresh performance, it’s often better to place calculations in a DAX measure. A good example of this is the multiplication or division of the values in two separate columns.
Measures can live anywhere, and have filter context by default, but not row context. They can be asked nicely to perform calculations with row context by using an iterator function such as SUMX or AVERAGEX. (Don’t worry if this is the first time you’re hearing the terms row and filter context – I cover them in more detail here).
So, long story short, whatever it is you’re trying to do inside your calculated column, if it produces a figure used in analysis, it would likely be better for your model if written as a measure.
Notable exception: If your calculation includes some gnarly DAX that performs too slow as a measure because its complex query is performed over a very large table or relies on the borrowing of data from many others. In this situation, I’ll allow staging elements of it in columns.
What is a measure?
A measure uses DAX to write calculations that summarise the columns of your data model. Measures have many uses, but are primarily used to present all of the figures that make up the metrics of your report.
Depending on your report’s complexity, you may also end up using them for tasks such as conditional formatting, text display or page navigation too.
Read more
Use Power Query
Use Power Query
Too often, I see calculated columns being used by previous Excel whizzes to concatenate two columns or write nested IFs that group, clean or transform data. These are not valid reasons to use a calculated column.
Instead, transformations like these should always be pushed back to Power Query (or even further if possible – but we’ll get to that). This is precisely why Microsoft named the button to get there ‘Transform Data’.
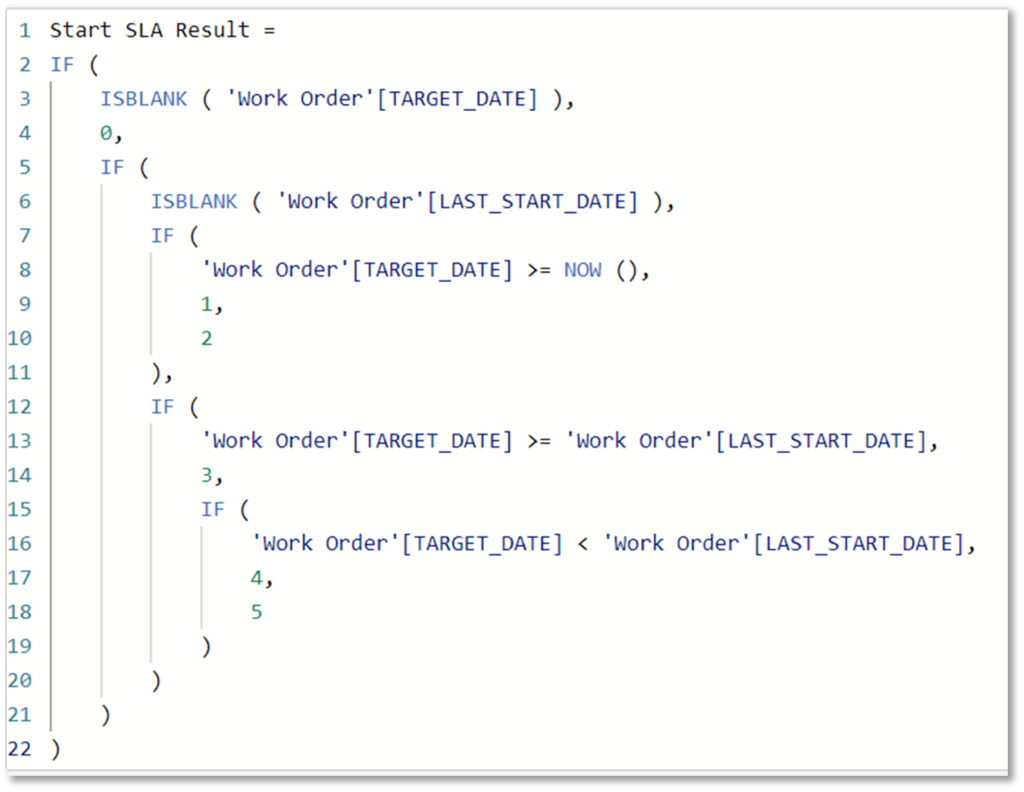
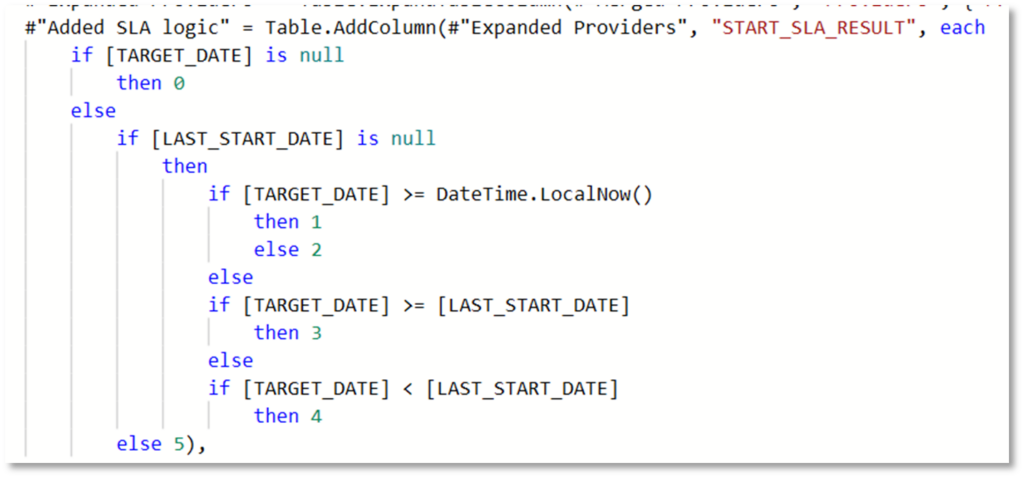
A prime example of DAX code for a calculated column that should instead be written in Power Query can be seen in Figure 1. Figure 2 shows exactly how it should be written using Power Query’s native language M code.
Power Query provides loads of user-friendly column transformations, often at the click of a button. It also lets you write your own custom columns if you can’t do the exact thing you want from the UI.
And if you need three staging columns to create the final column used in the analysis, Power Query will let you remove these before you load the only useful (final) column for use in a report. Doing this in calculated columns would either leave you with one overly complex DAX statement, or three redundant columns, causing clutter and performance degradations.
Create transformation columns before they enter Power BI
Create transformation columns before they enter Power BI
This might sound odd, given that I’ve just told you to push almost all calculated columns back to Power Query, but column transformations should actually be pushed even further back if possible. This is a vital part of Roches Maxim, which states:
Data should be transformed as far upstream as possible, and as far downstream as necessary.
You can also find more information on Roches Maxim here.
If your data comes from any kind of database, transformations should be pushed there, to take place before entering Power BI. This way they’ll be created and updated using the processing power of that database, rather than Power BI. And they’ll be available to more users in more models, with everyone using the same logic, creating consistency and harmony in data use.
Transforming the data before it reaches Power BI also helps reduce the likelihood of you breaking what’s known as query folding through doing something too complex with Power Query.
Query folding is Power BI’s ability to send a single query statement to the underlying data source, with the data being returned in the exact state it requires.
Once query folding is broken, data refreshes take longer because Power BI must first retrieve all the data from source, before working through the remaining steps sequentially to present it in the state required.
For example, say you require the last three months of data only from a table containing three years’ worth of data. If your first step has broken query folding, perhaps by changing a data type or adding a column with complex logic, Power BI must retrieve all three years of data before applying the three month filter in-house. With query folding in place, Power BI will simply submit a query asking for the three months it needs. This difference will have a significant impact on the speed of and resources required by a refresh.
Using Power Query effectively
When using Power Query, you must strive to keep the number of steps to the minimum possible. This improves performance, as the more steps Power Query has to navigate through, the longer your data model will take to refresh. Streamlined steps are also tidier and more user-friendly.
When transforming data with Power Query, always keep in mind that at some stage you’ll need to change something that’s many steps before the end. Or someone else will have to interpret everything you’ve done while you’re relaxing on a beach or in a new role.
And when this happens, there’s nothing worse than clicking Transform Data, only to be greeted with 300 applied steps. Have fun sifting through all those!
To keep your Power Query steps tidy and minimised, you should:
- Learn the structure and syntax of M code.
- Use the Advanced Editor to combine as many steps as possible into one.
- Save all your ‘Change Type’, ‘Rename Columns’ or ‘Remove Columns’ steps to the end, then apply them as one.
- And please, please, please rename & annotate your steps so it’s easy to understand – for you and others – what each one does.
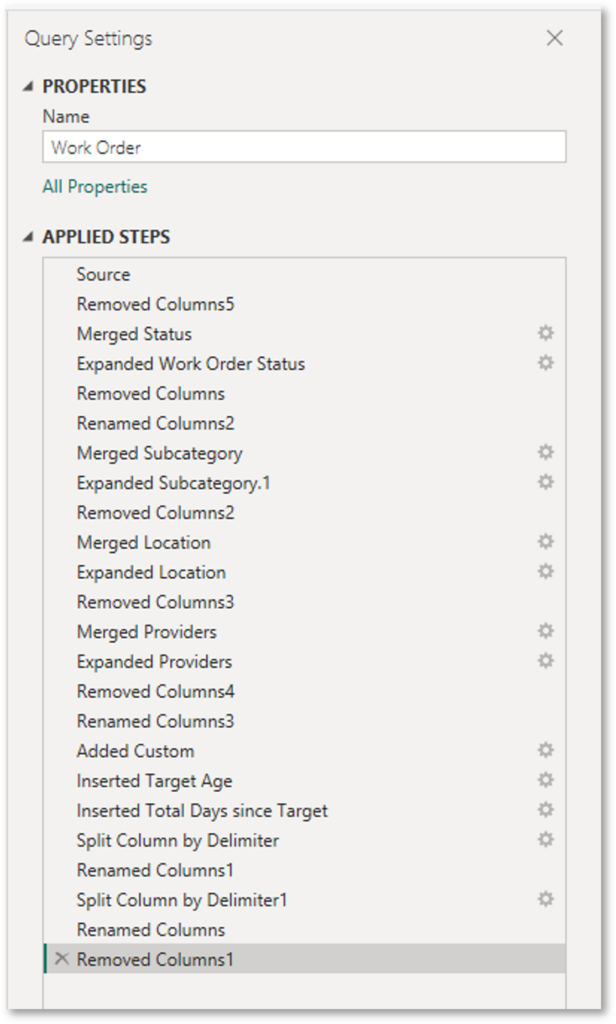
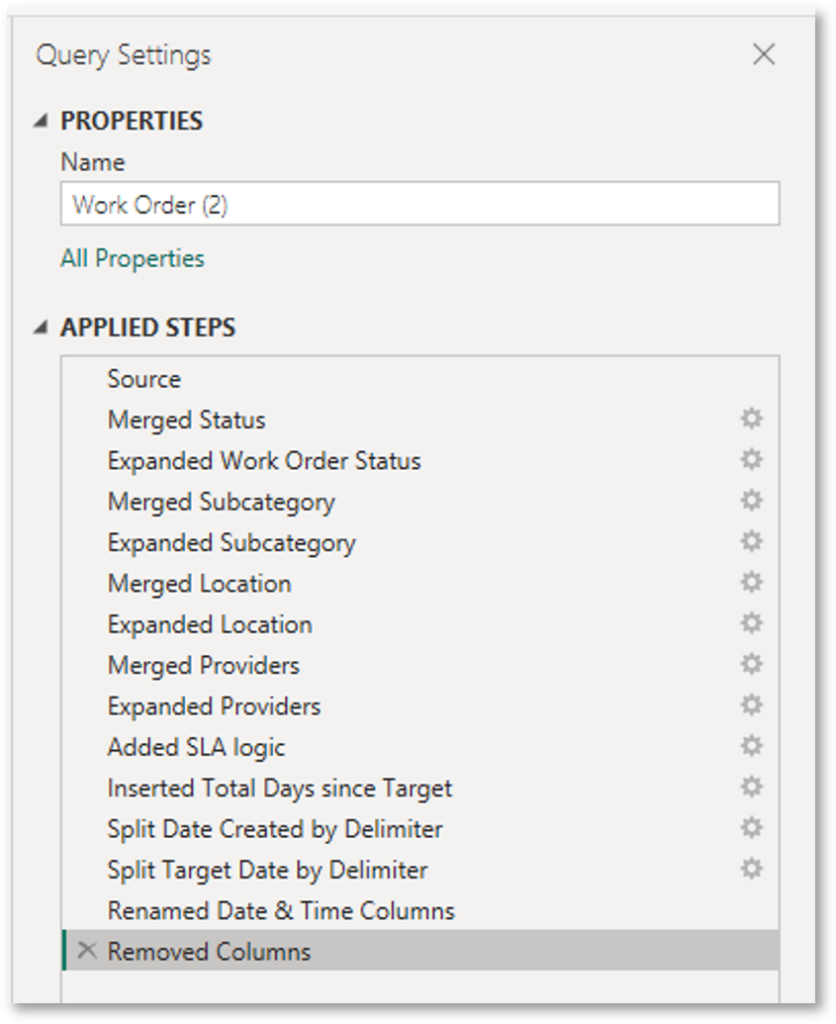
Figure 3 shows an example where someone (me, on purpose) has carelessly applied steps as the thought has entered their head, and not bothered with renaming.
Figure 4 shows how these steps can be tidied up to produce the same result with far fewer implications for future maintenance and thus headaches.
Perhaps more importantly, a refresh of these steps shows better performance. The table in Figure 3 took 21.14 seconds (it’s only 5,000 rows of sample data). Whereas this reduced to 15.45 seconds for the query in Figure 4.
Now, this may only be a reduction of just over 6 seconds, but that’s 27%! Apply that to a table that’s taking an hour to refresh, and you’ll save 16 minutes.
To explain why this happens, imagine you’ve been tasked with picking up items of rubbish washed up on a beach. If you were to walk to and from the bin picking up each item individually, it would take a lot longer than walking around and picking up multiple items at a time, before returning to the bin once with all items.
It’s the same principle with Power Query — the more steps you give it to navigate through, the more time your data model will take to refresh.
So, tidy up your steps, people.
Wrapping Up
Hopefully, I’ve given you enough good reasons to put the calculated columns out to pasture, and instead use Measures, Power Query or the underlying data source to transform your data. And when using Power Query, to treat it with the same care and attention you would a report page. Your data will spend less time refreshing and more time being analysed.