Ever find yourself frustrated with Power BI’s behaviour?
This will be the flexibility and ease of use built in to make it accessible to all. Whilst it offers many ways to achieve the same result, this is both a blessing and a curse. It leads to widespread bad practices as people pick the quickest path, not necessarily the correct or most efficient one. Correcting these issues not only wastes time but risks undermining user trust in your data.
Understanding what lies beneath these bad practices is critical to avoiding them, and getting the most out of Power BI. Keep reading to learn how to create top-notch models and reports while reducing errors.
What you’ll learn from this blog series
This series is designed to stop you falling into the traps of taking the easiest path. I describe in detail 10 of the biggest mistakes you can make in Power BI, why you should avoid them, and what to do instead.
By absorbing and applying the concepts and advice given you’ll set yourself up to:
- Create models and reports with efficiency and best practice in mind
- Ensure your end users will get the most out of your reporting
- Reduce the likelihood of repeatedly having to diagnose and correct errors
- Go back and correct all the early mistakes you made
Top ten common Power BI mistakes
Why ‘One Big Table’ data models are a bad idea
Why ‘One Big Table’ data models are a bad idea
Unless it’s a quick proof of concept, ditch the one big table. Instead, opt for a star schema with facts and dimensions tailored to your organisation’s analysis needs. This not only boosts model performance but also helps developers create reports more effectively.
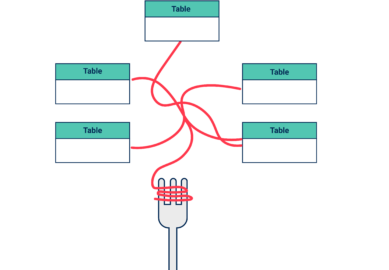
Why Spaghetti Junction-style data models hinder reporting and confuse users
Why Spaghetti Junction-style data models hinder reporting and confuse users
Do not think it’s ok to import every table from your relational database into your model. Carefully consider which are going to be useful, and how, then ask yourself which of these can form a single dimension. Your aim is to ensure dimensions only have one routeway to the fact, and to make your model a lot easier for those users.
Why hoarding unnecessary data makes your model cluttered and slow
Why hoarding unnecessary data makes your model cluttered and slow
Remove any column that will not be used in analysis or a relationship from the model, you wont get any points for hoarding data and you’ll needlessly be making your model slower at both refreshing and processing queries.
Why calculated columns are a no-no for transforming data – but so is going berserk in Power Query
Why calculated columns are a no-no for transforming data – but so is going berserk in Power Query
Avoid using calculated columns unless absolutely necessary, as they consume more space and can impact performance. Instead, consider using measures for calculations, and handling logic in Power Query or at the database level. Learning M Code in Power Query can enhance both performance and readability.
Why pivoted data leads to Power BI pain
Why pivoted data leads to Power BI pain
Don’t use pivoted data, it’ll quickly become your worst nightmare and cause your data model to spin out of control. Simply unpivot it within the data source or by using one of Power Query’s nifty transformations, then savour the simplicity and performance benefits it’ll bring.
Why you should ditch the auto date/time setting
Why you should ditch the auto date/time setting
Using the Auto Date/Time will be to the detriment of your DAX writing, model size and performance. It also has zero flexibility and therefore will not accommodate any complex reporting requirements or custom calendars, use it at your peril.
Why bi-directional relationship issues will cause headaches
Why bi-directional relationship issues will cause headaches
Bi-directional relationships will lead you down a path of slower queries, ambiguity, incorrect results, missing data, tables that wont join, RLS errors and broken time intelligence – none of which are very fun to be diagnosing. There is always a better way to model such a situation.
Why you shouldn’t neglect getting to grips with row and filter context
Why you shouldn’t neglect getting to grips with row and filter context
Depending on how much you know about them, Row and Filter Context can be your best friends or biggest enemies. Don’t let it be the latter. Dedicate time to mastering them so you can create precise, complex calculations, manage filters, and create more flexible reports.
Why launching untested and un-optimised DAX is a bad idea
Why launching untested and un-optimised DAX is a bad idea
Ensure the DAX you unleash on your stakeholders is tested and optimised. It’s no good them sitting looking at the spinning wheel for 20 seconds only to receive the wrong figure when, with a bit more work, your calculation could’ve returned the correct one in 5.
Why too many visuals lead to slow and confusing reporting
Why too many visuals lead to slow and confusing reporting
Don’t overcrowd your page. This goes for text, headers, icons, pictures, filters, visuals or anything else you deem fit for a report page. The more items on it, the more time everything takes to load and you may end up distracting your stakeholders from the most relevant information.
As the volume of data in the world continues to grow rapidly, it’s increasingly vital to understand Power BI best practice and the optimal ways to work with said data. Ignore this fact, and you’re going to severely compromise your ability to provide effective reporting to your organisation. Through this series, you’ll gain the knowledge needed to avoid common errors and improve your Power BI projects.


